| Starflower Software |

| Dimlog | Dimlog manual |
Statistics
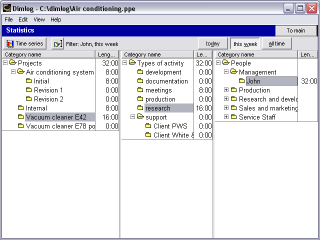
The Statistics view displays the amount of time that is spent on projects, and other categories.
To view statistics that are summarized per day, week or month, click the Time Series button, which will open the Time Series window.
To view the amount of time that is spent on a combination of categories, select one of the categories, and press F4 to set a filter on the category. All categories will then show the amount of time that is spent on the category and the filtered category.
It is also possible to set the filter to a time span (today, this week, etc.). Click on the button to the left of Filter: to set a time filter.
To export the statistics of one category tree to HTML, right click on a root category (such as Projects), and select Export to HTML.