| Project Tracker ManualClose | Project Tracker manual |
Statistics
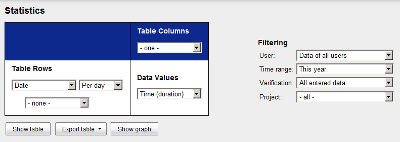
The left side of the statistics screen provides a sort of preview of the table that will be generated. In this preview, you can select what must be in the table columns, the table rows, and what which data values will be in the table cells. The table rows can be grouped on date, user or project. A multi-level grouping can be specified (for example, first group on date, then on project).
Using the data values drop-down box, you can choose to see only the time spent, only expenses, or both. Optionally, time can be converted to cost. To convert time that was spent to a cost value, the basic cost rate of time, and the cost factors of the categories on which the time was booked, are used. The drop-down box also contains the numerical fields. When a numeric field is chosen, the statistics will be calculated for the selected numeric field.
On the right side are the filtering options:
- User: Choose whether only the data of the current user is displayed, or of all users. To view statistics of all users, permission to "Read all spendings" is needed on the applicable projects. Projects for which you have not sufficient permissions are filtered out.
- Time range: Data outside the time range is not taken into account.
- Verification: Choose whether to use all spending entries or only those entries which have been accepted by the manager of the user.
- Project filter: By default all projects are taken into account, but you can choose here to see the statistics of only one project or sub project.
- Category filter: In the same way you can specify a filter on a category of a List/Tree type field.
- Split on: When this option is enabled, a separate column is used for each sub project (or sub category), when the output format is table-based. For graphs, this options enables stacked bar graphs.
Statistics are available in several output formats.
- To show the statistics in a table on the web page, click the 'Show table' button.
- To export to a CSV file, click the 'Export table' button, and select Export to CSV. CSV means Comma Separated Values. CSV is a text-based format that can be imported in spreadsheet software.
- To export to an Excel file, click the 'Export table' button, and select Export XLS (Excel).
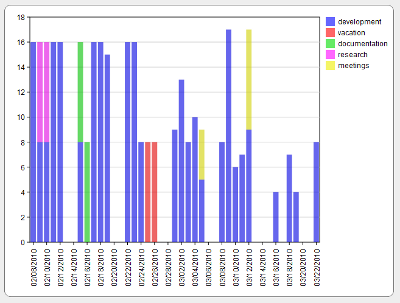
- To show the statistics in a graph on the web page, click the 'Show graph' button. A bar chart or a stacked bar chart will be generated. Multiple grouping levels are not supported in the bar chart view. To save the graph, use the functionality provided by the web browser, for example: Right-click on the graph, and select "Save image as...".